Many traders use the RSI indicator in their trading system to create a highly effective trading system. So what is RSI? Along with Exness learn more through the following article.
Table of Contents
What is RSI?
RSI stands for Relative Strength Index – relative strength index. RSI was developed by J. Welles Wilder and is used as an indicator of oscillation, helping to measure the speed and change of price movements.
The RSI indicator fluctuates between 0 and 100 to measure overbought – and oversold – of the market. According to Mr. Wilder’s theory, when the RSI is below 30, the market is in oversold condition; when the RSI is above 70, the market is in overbought condition. When overbought or oversold conditions occur, the market is expected to reverse in the opposite direction.
The RSI indicator is one of the most popular technical analysis indicators in the Forex market, Stock market, as well as the Futures market.
What Is The Meaning Of RSI?
The RSI indicator is usually presented as a horizontal chart, attached to the bottom of the currency pair chart, has a single line ranging from 0 to 100.
The RSI in the 0-30 range shows oversold market conditions with a high possibility of a bullish correction.
An RSI between 30-70 is generally considered neutral (neither overbought or oversold).
An RSI in the 70-100 range often indicates an overbought market with a high probability of a price correction in a downward direction.
When the RSI crosses from below the centerline (the 50 level) to the upper area, this usually indicates an uptrend in the pair being affected.
When the RSI crosses from above the centerline to the zone below it, this usually shows a bearish trend in the pair being affected.
How to Use the Basic RSI Indicator
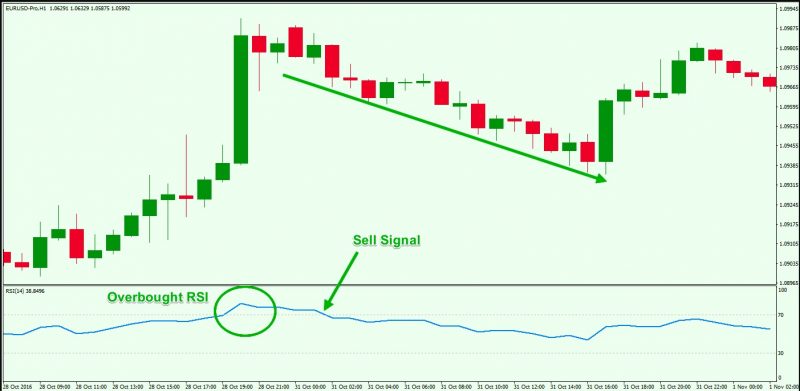
The most basic use of the RSI indicator is to wait for the RSI to cross above the 70 zone, show an overbought – in the market, then cut back to sell, or wait for the RSI to cross below. the 30th zone, which represents oversold – in the market, then cuts up again to buy.
As can be seen from the illustration above, the RSI indicator provides some profitable trading signals, however not always the RSI goes below 30 and turns up again or goes above 70 and Back down also creates good trading opportunities. To use RSI effectively, Traders need to incorporate a number of other tools.
Formula of RSI?
The formula for calculating RSI is as follows:
RSI = 100 – 100 / (1 + RS)
In which, RS (Relative Strength), known as relative strength, has the following calculation:
RS = Average Gain / Average Loss
(Average increase in increments over a selected period of time / Average decrease in number of declines over a selected time period)
According to Wilder, the default RSI time period is 14.
RSI Signals
The RSI indicator has 3 basic signals that traders can use to make their analysis and trading strategies. So what signals does RSI provide?
Overbought – What Is Overbought RSI?
When the RSI is above 70, the market is overbought. This usually happens when a trend shows signs of an increase and is a signal that the market will reverse and decline again.
Oversold – What is an RSI Over Sale?
On the contrary, when the RSI is less than 30, the market is in oversold condition. This usually happens when the trend shows signs of a downtrend and is a signal that the market will reverse a rebound.
Divergence – What Is RSI Divergence?
The RSI can also show divergence where the RSI line trended the opposite of the popular price action. Divergence can be either bullish or bearish. Both forms may indicate that a developing market reversal is likely.
Up RSI Divergence: A bullish RSI divergence usually occurs whenever the price of a currency pair falls and the RSI line is rising, which is a strong bullish signal.
Bearish RSI Divergence: A bearish RSI divergence usually occurs when the price of a currency pair is trending up and the RSI line is falling, which is a strong bearish signal.
Difference Between RSI And MACD
Moving Average Convergence Divergence (MACD) is a momentum indicator that shows market direction as well as shows the relationship between two price moving averages. The MACD is formed from 2 moving averages. The first line formed from the difference between the 12-period EMA and the 26-period EMA, is called the MACD line. The second line is formed from the 9-period EMA of the MACD line that formed earlier and is called the signal line.
The 9-day EMA of MACD, called the “signal line”, is drawn above the MACD line, which can act as a trigger for buy and sell signals. Traders can buy shares when the MACD crosses above its signal line, and sell shares when the MACD crosses below its signal line.
The RSI is designed to indicate whether a security is being overbought or oversold in relation to recent prices. The RSI is calculated using the average amount of profit and loss over a given period of time. The default interval is 14 sessions with values limited from 0 to 100.
MACD measures the relationship between two EMAs, while RSI measures price change in relation to recent highs and lows. These two indicators are often used together to provide analysts with a more complete technical picture of the market.
These indicators all measure the momentum of an asset. However, they measure different factors so they sometimes give conflicting indications. For example, the RSI might display a value above 70 for a continuous period of time, indicating that the security is being overexploited from the buying side.
At the same time, the MACD may indicate that buying momentum is still increasing. Either indicator can signal an upcoming trend change by showing a divergence with the price (the price continues higher while the indicator is bearish, or vice versa).
What Are The Common Mistakes Using The RSI Indicator?
Traders often use trading indicators mechanically. This is extremely harmful because trading indicators have their own meaning. Therefore, you need to understand thoroughly to be able to use them most effectively. The two fundamental mistakes that most traders often make are:
Execute a buy order when the market is oversold
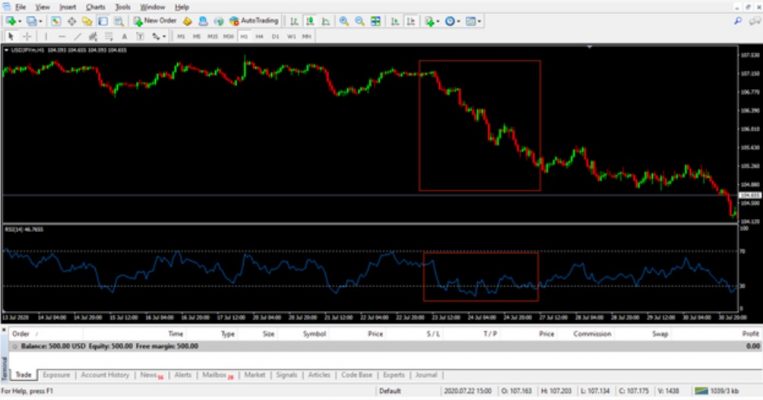
This is a real market example for the USDJPYm pair, you can see the RSI continuously entering the oversold zone (RSI <30) and remaining in this zone for a while, however the price continues. decrease and make new lows lower than the old lows. In this case, if you only follow the RSI indicator to trade, you will likely have an unfavorable trade order.
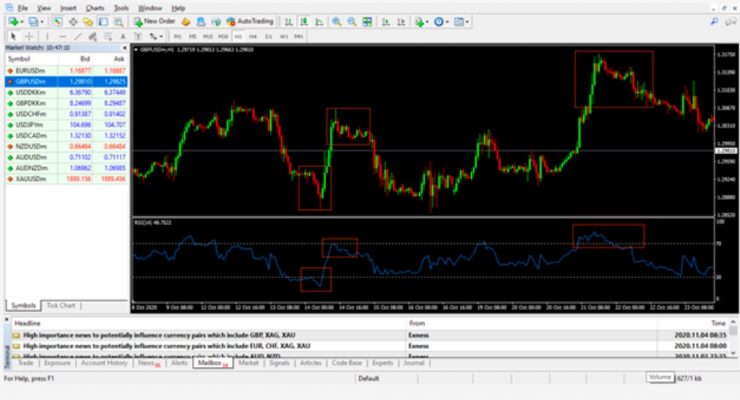
Execute sell orders when the market is overbought
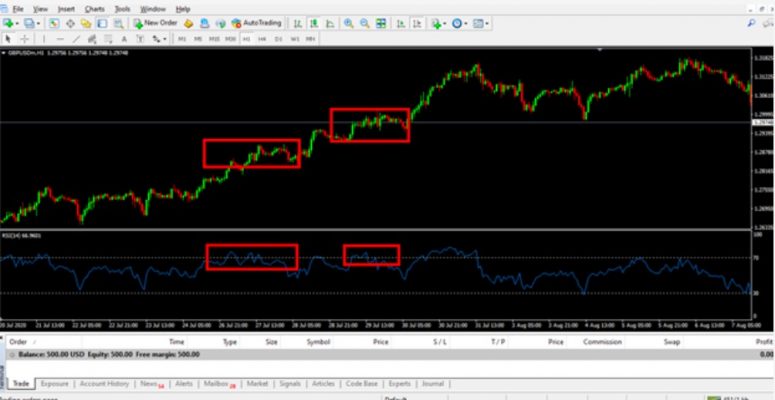
Similar to the above mistake, for GBPUSDm, the RSI continuously entered the overbought zone (RSI> 70), however the price continued to rise and made new highs higher than the old ones. In this case, the reversal you expected from the RSI signal did not occur.
Therefore, using RSI indicator machines when analyzing overbought or oversold markets to predict market reversals is a common mistake, and can lead to undesirable trading results. .
How To Set Effective Stop Loss And Take Profit Levels With RSI?
When using RSI, it is ideal that you place your stop loss above the recent high or low before the reversal price you are trading with.
The ideal take profit level is when the RSI crosses above or below the centerline (the 50 level); at that point, you should close your profit (if any) by using a stop loss order. In some cases, the trend can reverse at or near the centerline; That is why this is an effective take profit level.
Note: Don’t Always Expect A Reversal Price
You shouldn’t always expect a price to reverse just because the RSI indicates overbought or oversold. A currency pair that is in a strong trend can be overbought or oversold for an extended period of time. Additionally, since the RSI is a momentum indicator, it can generate a lot of false signals if the instrument it is measuring exhibits strong trend characteristics. You should always use stop losses to minimize your risk when trading on RSI.
There are other ways to use RSI, like using the RSI indicator to find divergences or combining the RSI indicator with the trend line, with support-resistance zones etc. However, these are more complex uses and are not suitable for Traders who are new to the financial market.
This investment is risky and may not be suitable for all investors. The investment value may increase and may also decrease, and the investor may lose all invested capital. Under no circumstances will Exness be liable to any person or entity, wholly or in part, for any loss or damage caused by, arising out of, or in connection with any transaction relating to an Investment Activity. Any opinions given may be of the author’s personal nature and may not reflect Exness’ opinion.
